Graphical Monitoring of Statistics Shared by Processes
K.S. Bhaskar
Quick Start
Monitor the shared database statistics of your existing applications in minutes, starting right now.
- Ensure that node.js is installed.
- Use the ydbinstall script to install the YottaDB GUI. (This also installs the YottaDB web server.)
- Ensure that in the environment of each application process, the variable ydb_statshare is set to 1.
- Start the YottaDB web server using the same global directory as your application.
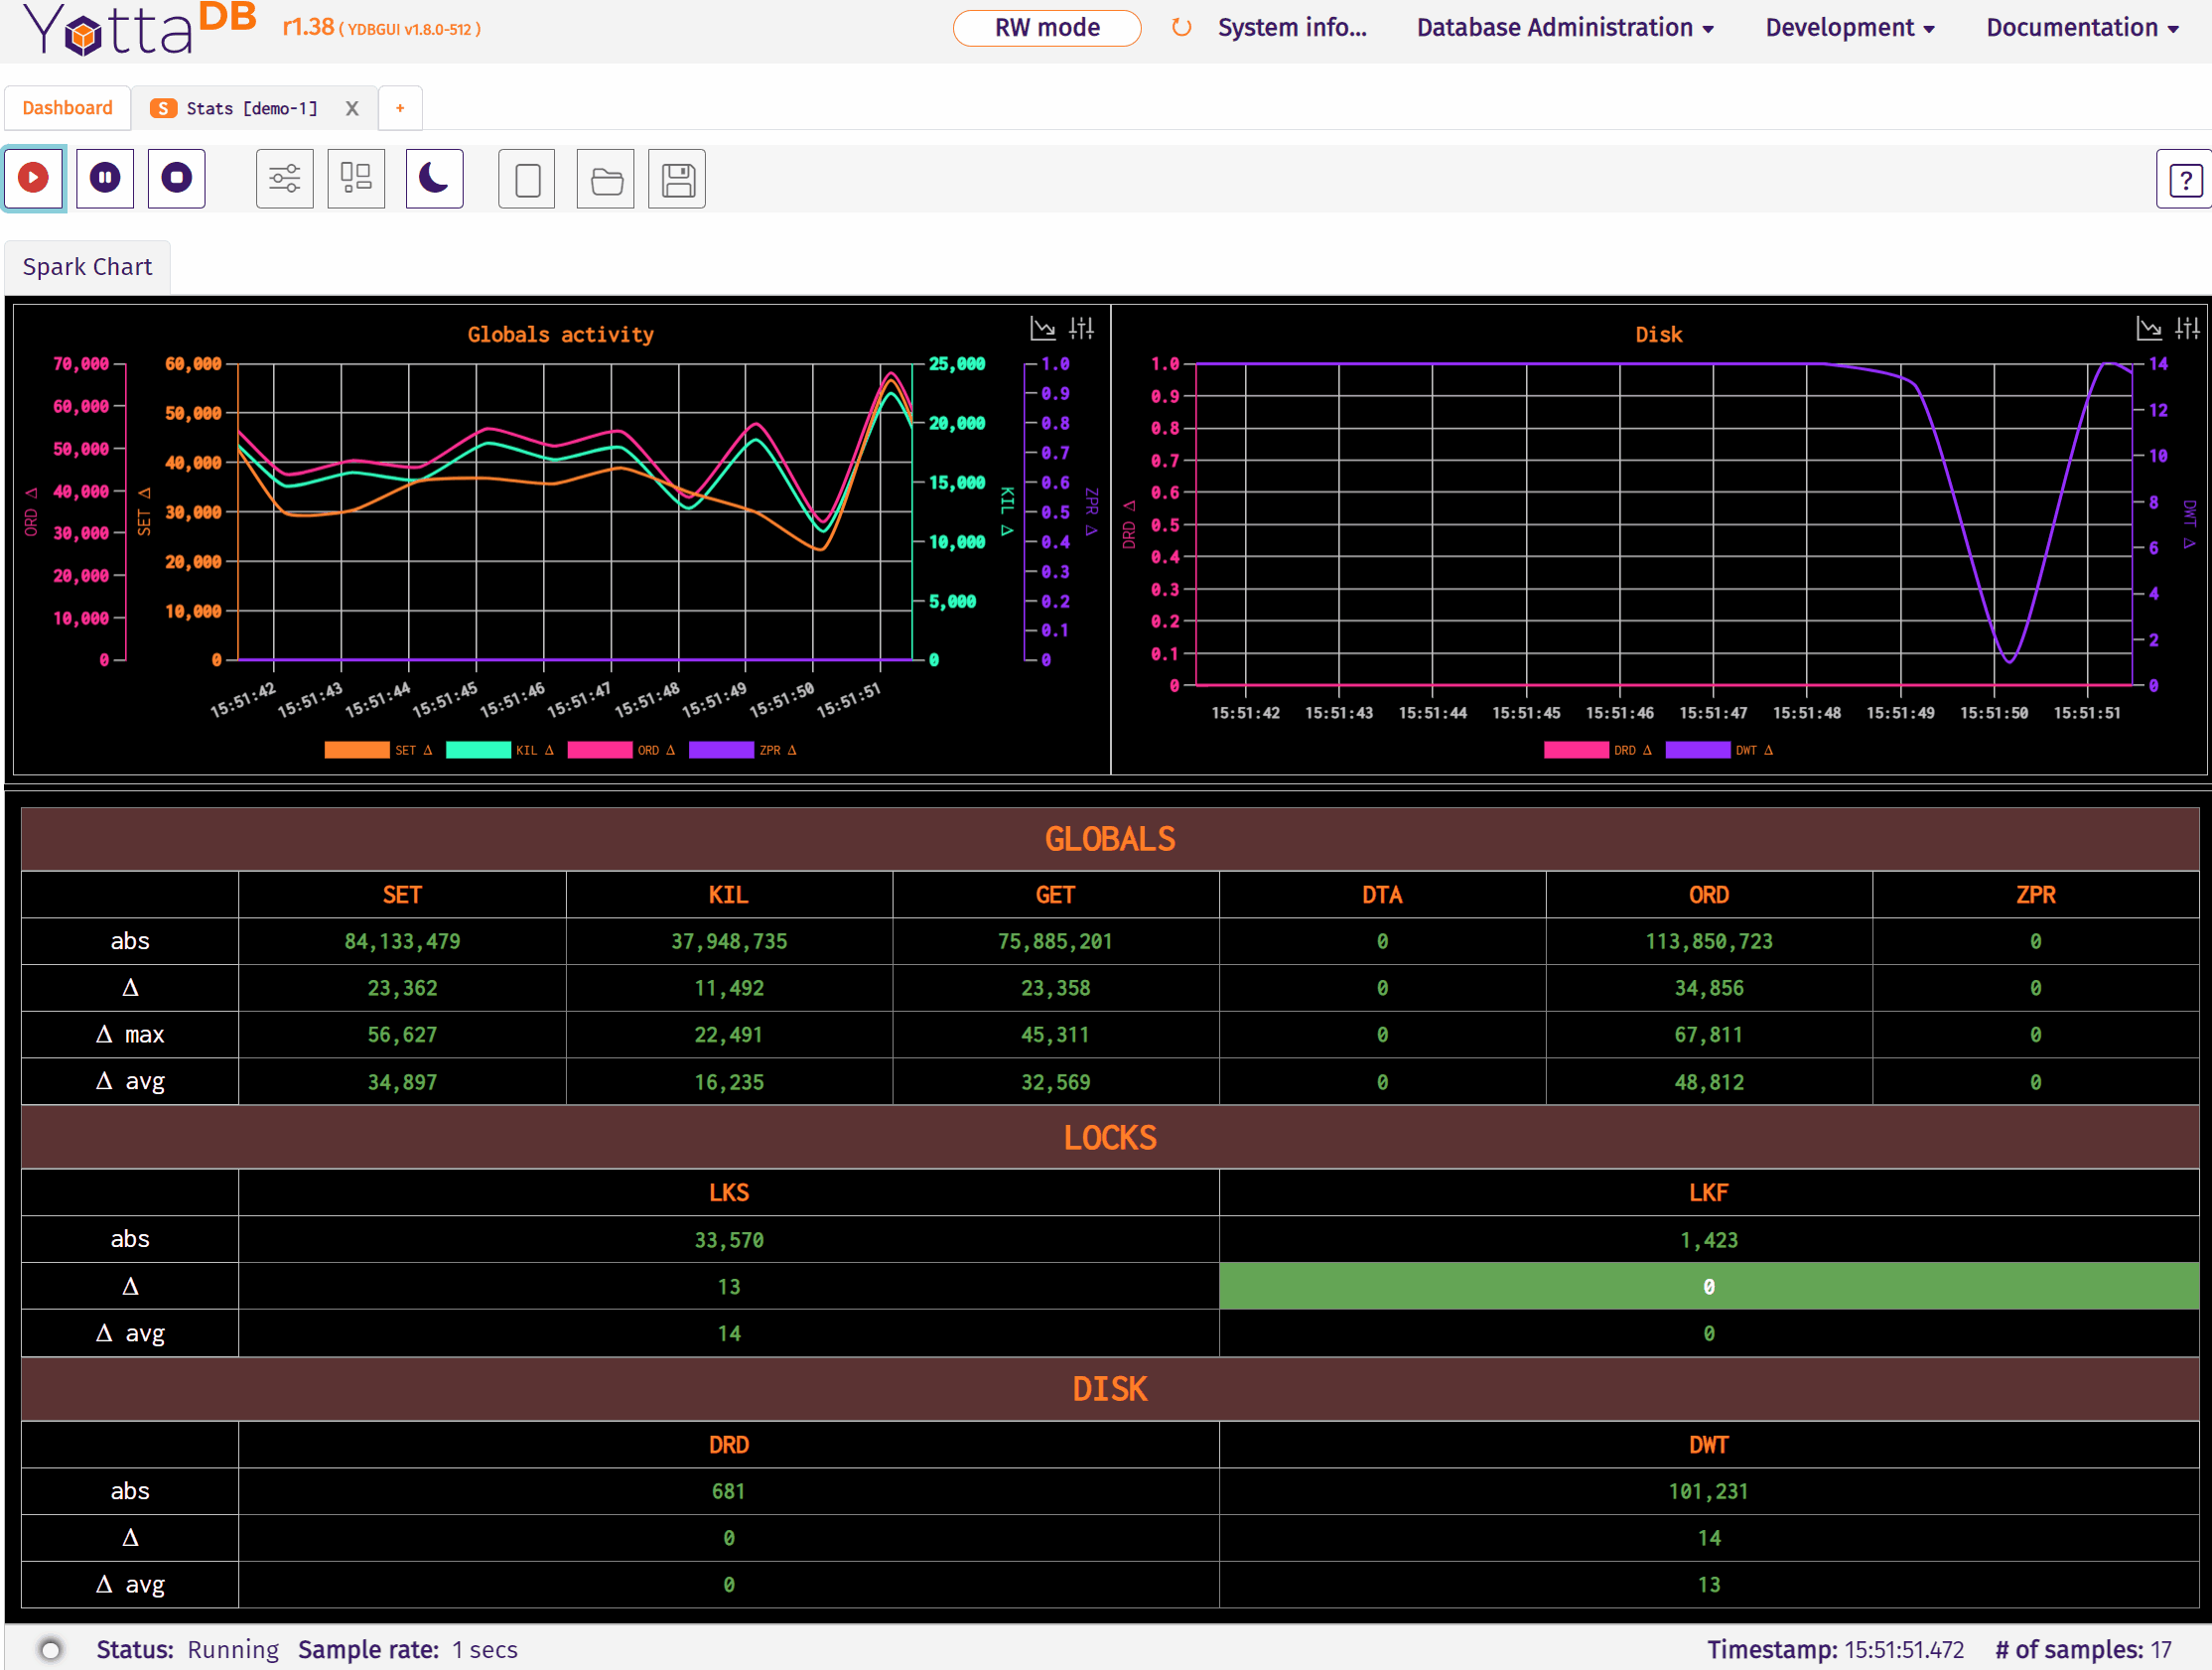
- Connect to the web server to start the YottaDB GUI. In the Dashboard, choose Database Administration / Monitor Database. Choose the data you want to monitor, and choose how you want it displayed. Click Start to see the data.
The GUI comes with a demo that includes a simulated application. This video walks you through using the demo.
Read on to dig deeper.
Motivation
Visual presentation is the most effective way most of us ingest complex data. As with the unique Minard depiction of Napoleon’s disastrous march on Moscow shown here, we routinely use graphs every day.
Processes accessing databases have tens of internal counters (collectively referred to as “statistics”) for each database file that they have open. The YottaDB GUI allows you to visually monitor these statistics in real time.
Statistics
There are two sources of statistics to monitor: statistics shared by processes and statistics in the database file header. Each has its uses.
Shared Statistics
YottaDB processes can opt to share their operational database statistics. If at process startup, the environment variable ydb_statshare is 1. Optionally, the environment variable ydb_statsdir can be set to a temporary directory for sharing and monitoring.
File Header Statistics
Statistics in the database file header capture the aggregate data of all processes accessing the database from the database creation. Viewing these statistics requires access to the database file but does not require application processes to share statistics.
Monitoring
Shared Statistics
Monitoring statistics shared by processes enables focused analysis, for example, visualization of current performance issues and the behavior of specific processes. The YottaDB GUI provides graphical monitoring of shared statistics.
With the intent of ensuring that it is intuitive to use, the GUI has integrated online documentation, including mouse-overs, but no separate user documentation other than installation instructions.
This video on this page walks you from start to finish, to graphically monitor statistics of an existing application on a remote server.
If you want to implement your own monitoring of shared statistics, YottaDB provides a %YGBLSTAT() utility program.
File Header Statistics
For production instances, we recommend continuously capturing statistics every minute or so. You can use the gvstat program program or write your own similar program. Capturing the data and creating baselines will help you in capacity planning as well as incident analysis. Continuously monitoring and displaying key parameters can additionally give you insight into the dynamic behavior of your application.
The guest blog post YottaDB Dashboard by Ram Sailopal demonstrates monitoring File Header Statistics with Grafana.
Security
Statistics are metadata, not data. While metadata should be shared advisedly, it does not typically have the same confidentiality restrictions as data. The GUI and web server follow normal YottaDB security policies.
- Processes must opt-in to share statistics.
- The web server process must be started by a userid on the system, and has no access capabilities beyond those of that userid.
- Database monitoring can be performed by a read-only GUI. You can see from the videos that the GUI is operating in read-only mode.
- While the GUI does have a read-write mode, for example, to support editing of global directories, database monitoring requires just read-only access.
- To access statistics, the web server needs access to the global directory and the $ydb_statsdir directory if it is specified. You can use Linux permissions to control access.
- The JavaScript libraries used are mature, versioned, and statically served from where the GUI is installed on the server.
Please Try It!
We invite you to use the GUI to monitor database statistics shared by your application processes and tell us what you think. As it is a new application, we are sure that it offers many opportunities for enhancement and improvement.
- If you have YottaDB support, please reach out to us through your YottaDB support channel.
- If you do not have YottaDB support, you can reach out to us:
- On the gui channel of our Discord server.
- By creating an Issue on the YDBGUI project at Gitlab.
Thank you for using the YottaDB GUI.
Published on January 25, 2024